Cybersecurity Vendor
Data & Report Design
The client is a global cybersecurity vendor with its own research and events program — the kind of company that regularly publishes its own data (bug bounty payouts, threat statistics, vulnerability trends) across a mix of formats: print magazines, conference materials, and stand-alone posters. Work for this client has covered a number of projects over time; the three below are among the most visually distinct.
Across these projects, my role has consistently been to take the client’s raw research data and turn it into a working visualization system inside their existing brand identity — deciding chart structure and visual hierarchy first, then designing every element to fit.
Standoff 365 — Bug Bounty, Mapped Like a Star Chart
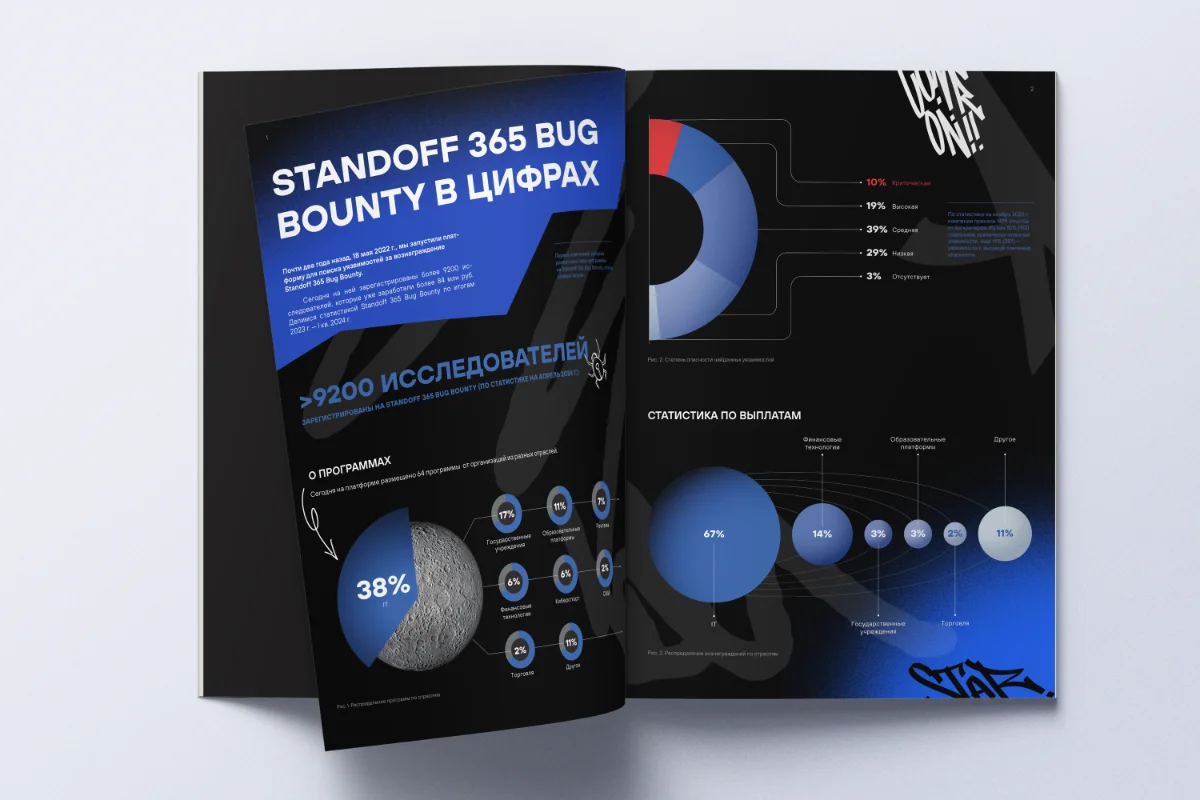
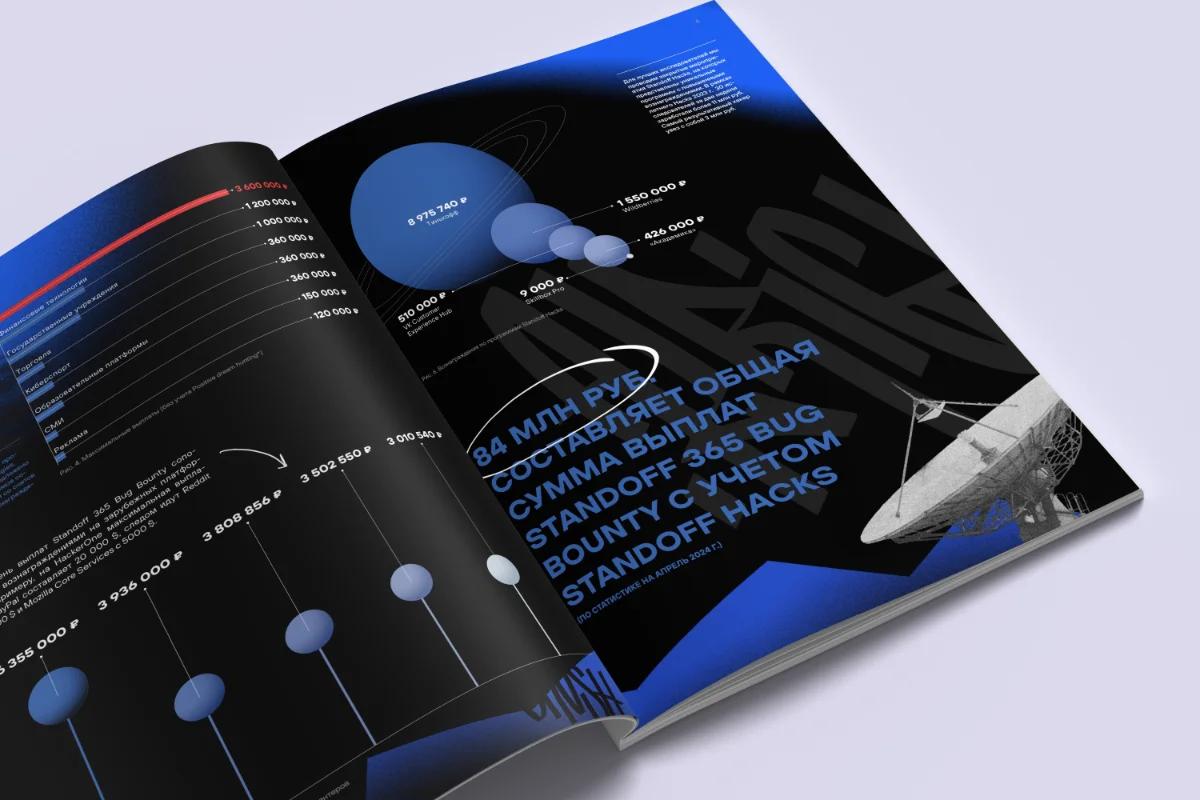
Standoff 365 is the client’s bug bounty platform, where researchers hunt for vulnerabilities on live, simulated infrastructure. These two spreads were designed for print, most likely for distribution at a conference or event alongside the rest of the publication.
the brief was to translate a year of bug bounty activity — payouts, vulnerabilities found, participating researchers — into two print spreads that had to sit inside Standoff’s existing visual identity: graffiti-style illustration, gradients, and a strict three-color palette of black, red, and white. That issue’s theme was space, and it needed to shape how the data itself was drawn, not just sit as decoration around it.
the data came in raw, so the first task was finding a structure before finding a look. The space theme shaped the chart language directly — payout figures became “planets” of varying size along an orbital path, and research-category breakdowns became a radial chart that reads like a star map, all built inside Standoff’s palette and graffiti-driven style rather than introducing a separate visual language on top of it.
01Reading the reference — the issue’s theme was space, and the client had already shown me posters built around it, using satellite and dish photography, so I knew the visual world I was working inside.
02Finding the metaphor — pie charts became planets almost immediately: adding orbits and varying each “planet’s” size by value was a clear, obvious fit. Some charts leaned more toward looking like satellites instead, so the metaphor didn’t repeat itself as one single idea across every chart.
03Adding depth — layered in shadow and grain effects on the charts themselves, so they felt more dimensional rather than flat.
04Approval — the direction was approved by the art director almost immediately and went through with very few changes.
Data Leaks Infographics
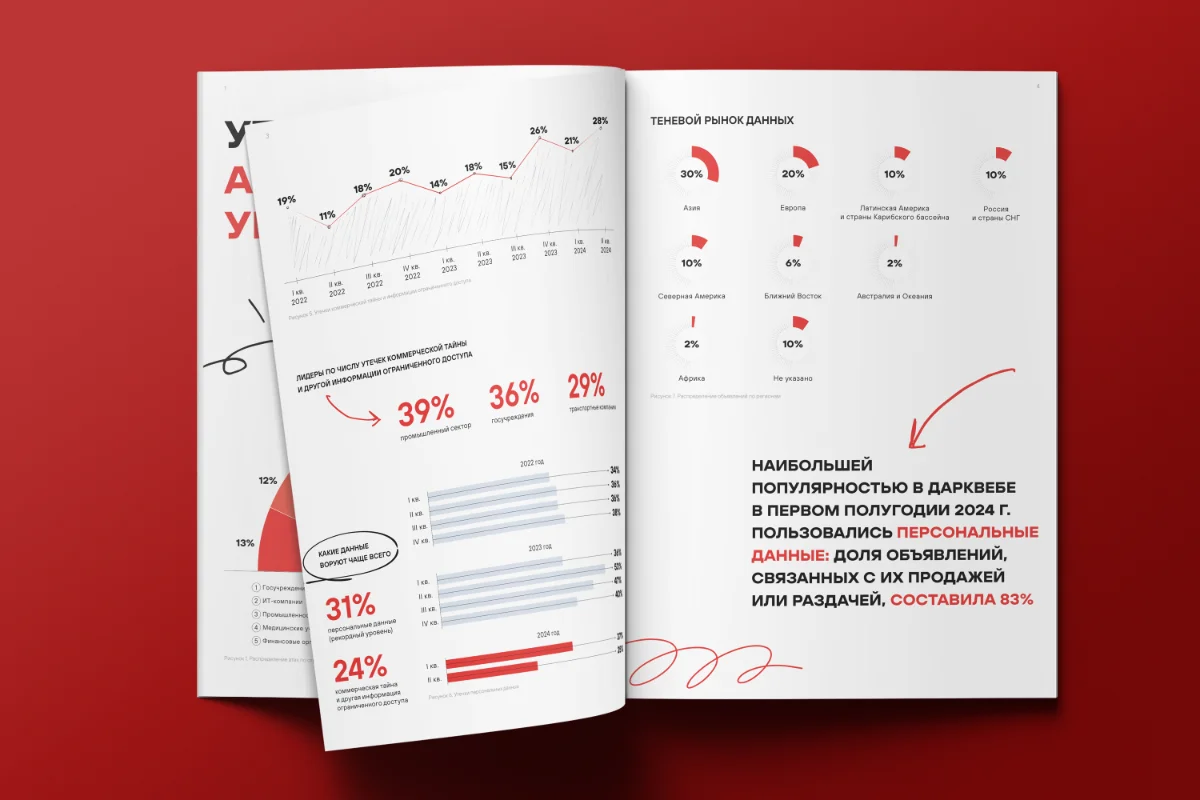
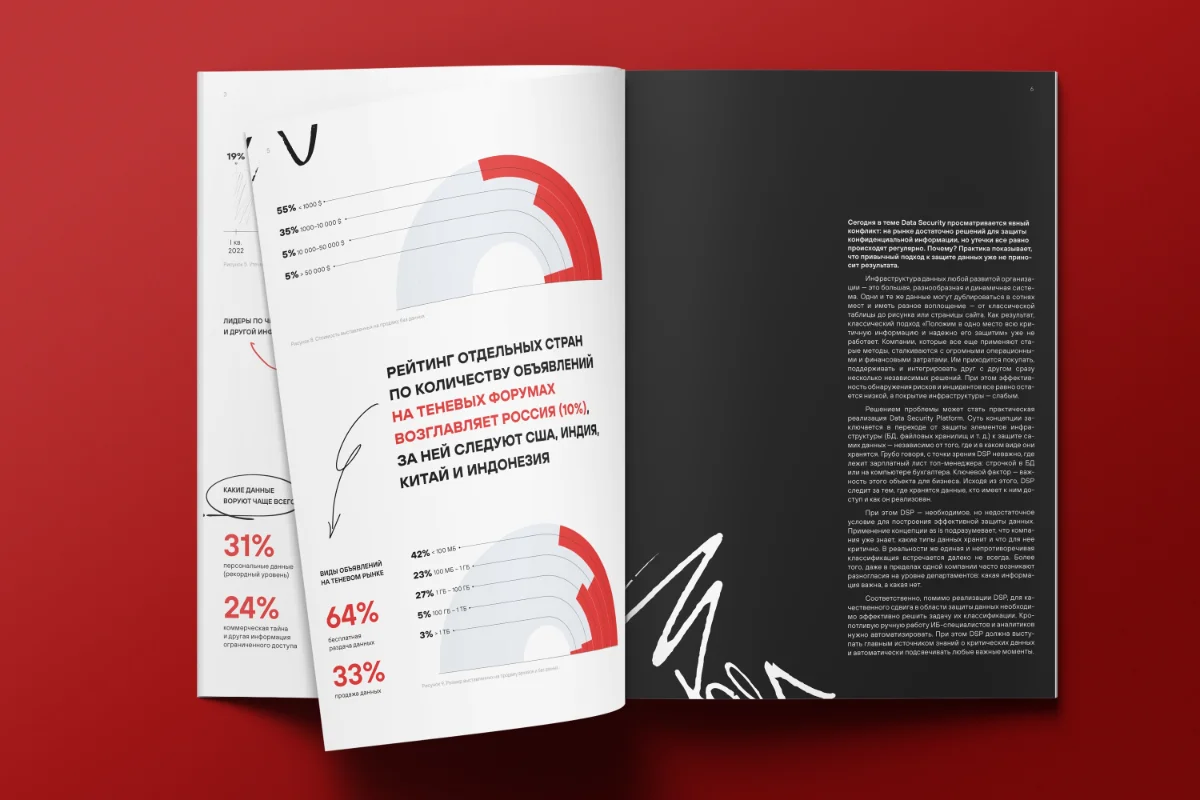
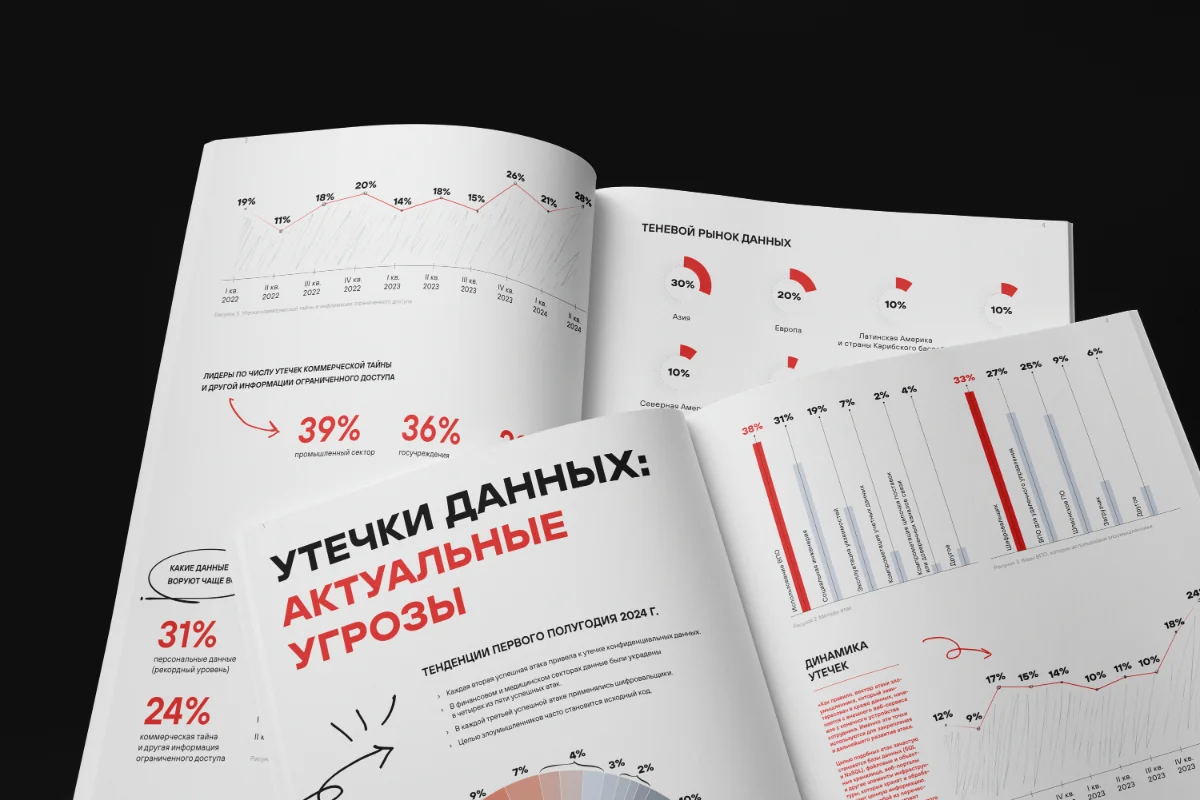
this project covers the infographic spreads for the client’s research report on data leak trends, covering the first half of 2024.
the report itself was dense — shadow data market activity, leak dynamics, breach statistics — and needed to become spreads a reader could scan at a glance without losing the detail researchers actually rely on.
each spread pairs one dominant number with its supporting chart — gauge charts for threat levels, bar and line charts for trends over time — inside the client’s established red, black, and white system. The same structure repeats across every section, so a reader can scan the whole report the same way from start to finish.
01Building on established work — this wasn’t the first project for this client in this space; a set of visual guides for charts and documentation had already developed across earlier projects, so this one worked from that existing system rather than starting fresh.
02Adding a hand-drawn layer — introduced small hand-drawn touches — arrows, scribbled marks, dots that look drawn by hand — continuing a style first used on the Cyberattacks Poster, the earliest project for this client. In that sense, this project reads as a direct continuation of that poster’s visual language.
03Designing to fit an existing layout — this ran inside a magazine rather than as stand-alone spreads: I received a finished page layout with empty spaces reserved for charts, and designed each graphic to fit the space I was given. The client’s in-house designers then placed the graphics and occasionally asked for a size adjustment, larger or smaller, to balance the page.
Cyberattacks Poster — Infographic Poster
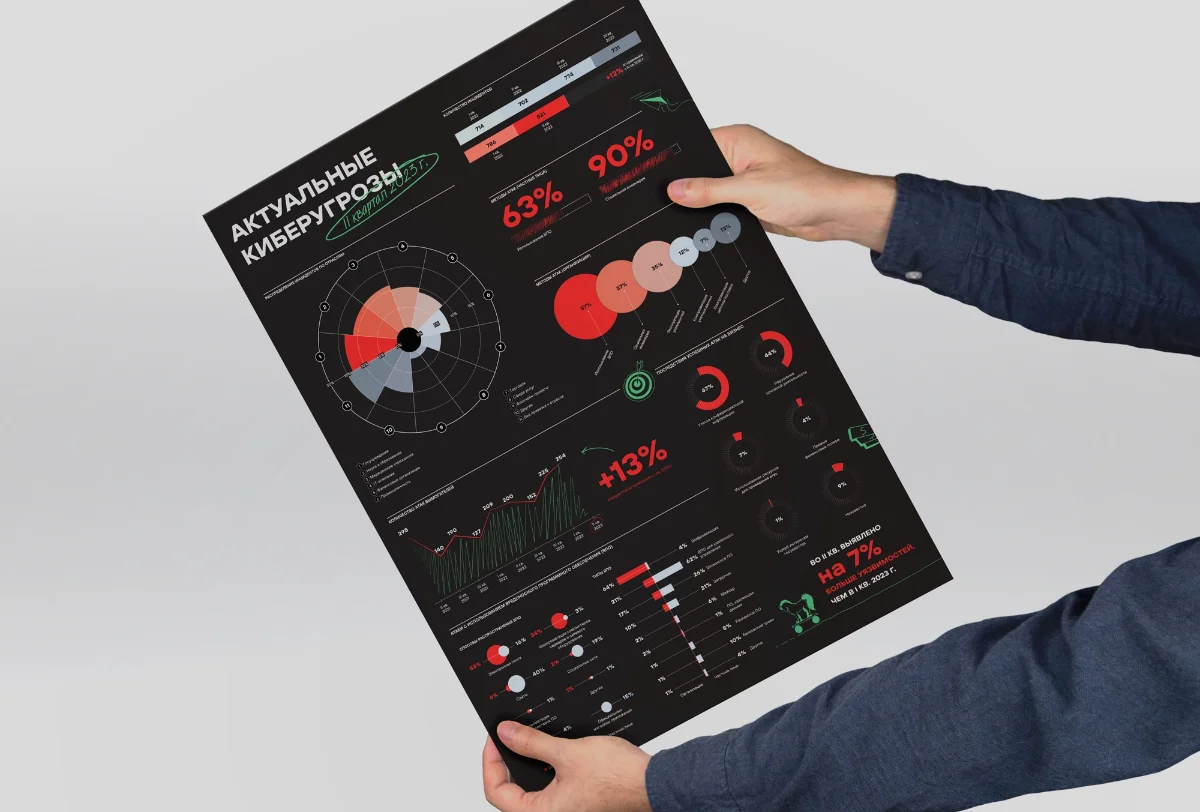
a fold-out poster designed as an insert for the client’s 2023 research magazine, covering data on cyberattacks, hackers, users, and organizations.
the source material arrived as raw Excel and Word data, and the poster had to physically fold twice to fit inside the magazine — meaning every chart and data point needed to stay clear of the fold lines while still reading clearly at both full size and folded down.
I proposed the visualization approach for most of the charts, working with the client’s art director to refine each one, with a single key visual built against a client reference. The result is a dense, varied set of statistics — from threat frequency to risk categories — organized into a format that holds up under a real physical constraint, not just on screen.
01Mapping the fold — set up an artboard at the poster’s actual size, since it would fold into four panels. The first step was counting how many charts needed to fit and figuring out how that number could split across the four surfaces.
02Blocking the layout — the front-facing panel took one large chart, the biggest in scope; the other three panels split the rest, roughly two charts each. This gave a rough block layout to work from before deciding on any chart types.
03Choosing visualizations — went back into the data itself, panel by panel, testing different chart types — pie, bar, and others — until each one found its right form, a more exploratory pass than a fixed plan.
04Refining with the art director — worked together to add graphic elements, adjust color where she asked, and refine the data and visualizations further.